Splunk Core Certified Power User
Exam preparation notes for the Splunk Core Certified Power User.
Transforming Commands
If you are doing search in smart mode, the mode that will toggle the search behavior based on if the search contains a transforming command. If it does, then it's going to act like fast mode,
top:
index=web | top file,index=security "fail*" | top src showperc=frare:
index=web |rare categoryIdstats:
index=web | stats sum(bytes)
index=web | stats count by categoryId
index=web | stats dc(categoryId)
# or
index=web categoryId=* | dedup categoryId
# or
index=web categoryId=* | dedup categoryId | stats list(categoryId)
# or
index=web | stats values(categoryId)

index=web | stats count by referer_domain, action
index=web | stats count by referer_domain, action | stats sum(count) by referer_domain
index=security | stats count by src, user, action
index=security | stats values(user) as "Login Name", count(user) as "Attempts" by src | fillnull value="N/A"
index=web OR index=security | stats sum(bytes) as Total_Bytes | eval Total_Bytes=tostring(Total_Bytes, "commas")
More useful commands:
index=web | table clientip, action, categoryId, status | where isnotnull(action)
index=web | table clientip, action, categoryId, status | where isnotnull(action) | rename action as "ACTION", clientip as "Shoppers IP" | fields - status
index=security user=admin vendor_action=Failed host=web1 src_ip="87.194.216.51" earliest=0 latest=now
Transaction Commands
maxspan: Max time between all related events, e.g.maxspan=15m.maxpause: Max time between each individual event, e.g.maxpause=1m.startswith&endswith: Set your variables for keywords.
Investigate the events
- Events that span time: Can come from multiple hosts, relate to one host of interest.
- Grouping of events: Show the entire conversation, from start to finish in one view.
- Aid investigations: Relate user activity for logins, session lengths, browsing history, etc.
- Log validation: Check to see if data is related to network logs of interest, website traffic, emails, etc.
Transaction vs. stats
| Transaction | Stats |
|---|---|
| Slow abd will tax your environment | Faster, more efficient searching |
| Granular analysis(logs, user behavior, conversations, etc,) | Looking at larger pool of events for trend analysis(no limit on number of events returned) |
| Small scope on one item of interest | Broad searching and grouping of events |
| Correlations need to be found from start to end | Mathematical functions needed |
Demo
index=web
| search status=404
| transaction JSESSIONID maxspan=10m maxpause=3sindex=security failed
| transaction src maxspan=3m maxpause=3s
| eval duration=tostring(duration, "duration") # evaluate a new field
| table src, durationindex=web
| transaction clientip maxspan=10m maxpause=3s endswith=purchase
| eval duration=tostring(duration, "duration")
| table clientip, duration, actionManipulating Your Data
eval
- Calculates fields: Does the math you ask: +, -, *, /, AND, XOR, >=, ==
- Functions friendly: Just like stats, it takes plenty of functional arguments:
if, null, true, cidrmatch, like, lookup, tostring, md5, now, strftime - Create new fields: Eval will take the results of the SPL into a field that is existing, or create a new one
- Coverting data: Tell Splunk to display a field value of bytes to megabytes by providing the math in an eval statement:
strftime, strptime.
where & search
| where | search |
|---|---|
| Can not place before first | in the SPL |
| Comparing values, or searching for a matching value | Search on a keyword, or matching value |
| Use with functions | Search with wildcards |
| *think boolean operators=where | *think expressional searches=search |
Demo
index=_internal
| eval epoch_time=strptime(_time, "%s")
| eval human_readable_time=strftime(epoch_time, "%m/%d/%y")
| table _time, epoch_time, human_readable_timeindex=_internal
| eval DayOfTheYear=strftime(_time, "%j")
| search DayOfTheYear=141index=web
| eval status_codes=case((status==404), "Not Found", (status==400), "Bad Request Response", (status==200), "Success")
| stats count by status, status_codesindex=web
| stats count(eval(status==404)) as "Number of not founds"index=web
| eval hash=md5(file)
| table file, hash
| dedup fileindex=security
| table src, user, action
| where like(src, "50.%") AND user="mail" # boolean logicindex=security
| table src, user, action
| where like(src, "50.%")
| search user=mailField Extractions
- Regex: Unstructured data
- Delimiters: Structured data
- Commands: Work with
rexanderexin your SPL.
rex uses a regex to create a new field out of a filed that already exists.
erex helps to generate the regex as long as you provide example of what you want to extract.
3 ways to navigate to Field Extractor:
- Settings > Fields > Fields Extractions > Open Field Extractor
- From the "Event Actions" dropdown menu
- The bottom of the left panel, under the "INTERESTING FIELDS"
Demo
index=cisco
| rex field=_raw (?<email>"\S+@\S+\.com")index=cisco
| erex files examples="text/css", "image/gif"
| stats values(files), values(http_content_type)Lookups
What's a lookup?
- A file. Mostly static data that is not in an index. e.g. csv of all employees.
- A tool. Add additional fields to search for. Fields will be added to the fields bar menu.
How to use?
- Data enrichment. Add information and store it in a table/file format to then search.
- Commands: lookup, inputlookup, outputlookup, OUTPUT, OUTPUTNEW.
- Create or Upload. Select a file to upload or make one to reference. Lookups can be configured to run automatically.
Demo1
Create a "Lookup table files"
| inputlookup peopleinfo.csv where (state="New York")Create a "Lookup definitions" using the created lookup table
peopleinfo.csv(file-based).Update permissions.
Demo2
Export the product ids as csv.
index=web | table productId | dedup productIdThen and additional information in the exported csv.
Create a "Lookup table files" using the updated csv.
Update permissions.
Search
index=web action=purchase | lookup productinfo.csv productId OUTPUT description | table productId descrition | where isnotnull(productId)index=web action=purchase | lookup productinfo.csv productId OUTPUT description | stats count by productId description | where isnotnull(productId) | sort - count
Visualization
Commands
- timechart: time series will display statistical trends over time, single or multi-series,
span=1d - chart: line, area, bar, bubble, pie, scatter, etc, stacking available, remove empty values
useother=f usenull=f - stats: can easily alter any stats table
- iplocation: add location info to your visualizations
- geostats: calculate functions to display on a cluster map.
latfield, longfield, globallimit, locallimit - addtotals: add multiple values together on a chart, compute total sums of values.
fieldname, label, labelfield - trendline: overlay on a chart to show the moving average.
sma, ema, wma
Options to set in visualization
- stacking: On=events are vertically stacked(top to bottom), Off=counts are horizontally stacked(left to right)
- overlay: add two line charts over each other
- trellis: display multiple charts at once
- multi-series: On=y-axis to split for each value, Off=all fields share the y-axis
Demo
Timechart:
index=web | timechart avg(bytes) by hostChart: doesn't give you data over time.
index=web | chart avg(bytes) by hostTimechart with where:
index=web | where isnotnull(action) | timechart count by actionuseother=f means takes the OTHER value off the chart. It displays the top 10 values by default, limit=0 means no limitation to return all values.
index=web action=purchase
| lookup productinfo.csv productId OUTPUT description
| where isnotnull(productId)
| chart count over host by description useother=f limit=0
Line chart
index=security Failed
| timechart count by user useother=f usenull=f limit=5
Area chart. Add 5-period simple moving average trendline for smoothing
index=_internal sourcetype=splunkd
| timechart count
| trendline sma5(count) as "Moving Average of Total Events"
It creates a new column "City" which based on the latitude and longitude information associated with the ip_address.
| inputlookup peopleinfo.csv
| iplocation ip_address
iplocation command can generate the latitude and longitude fields if they don't exists.
index=web | iplocation clientipCluster map
| inputlookup peopleinfo.csv
| geostats latfield=lat longfield=long globallimit=10 count by emailindex=web action=purchase
| iplocation clientip
| geostats count by action
| where purchase>500addtotals or change the options in the statistics format(Format -> Summary -> Totals/Percentages).
index=web action=purchase
| iplocation clientip
| geostats count by action
| addtotals row=f col=t label="Total Purchases" labelfield=longitude purchase
Reports & Drilldowns
What are reports?
- A saved search: anything that is a search can be saved as a report.
- Live results: re-run a report, or set it to run on a schedule.
- Sharable Knowledge Object: let anyone view your reports, or add them to a dashboard for people to reference.
- Splunk knowledge object naming convention best practice:
{group_name}_{object}_{description}
Drilldown Functionality(Interactions)
- Actions: link to search, link to dashboard, link to report
- $token$: tokens play a key role in passing variables from panel to panel
- Export: export as a PDF, print, or include in a report
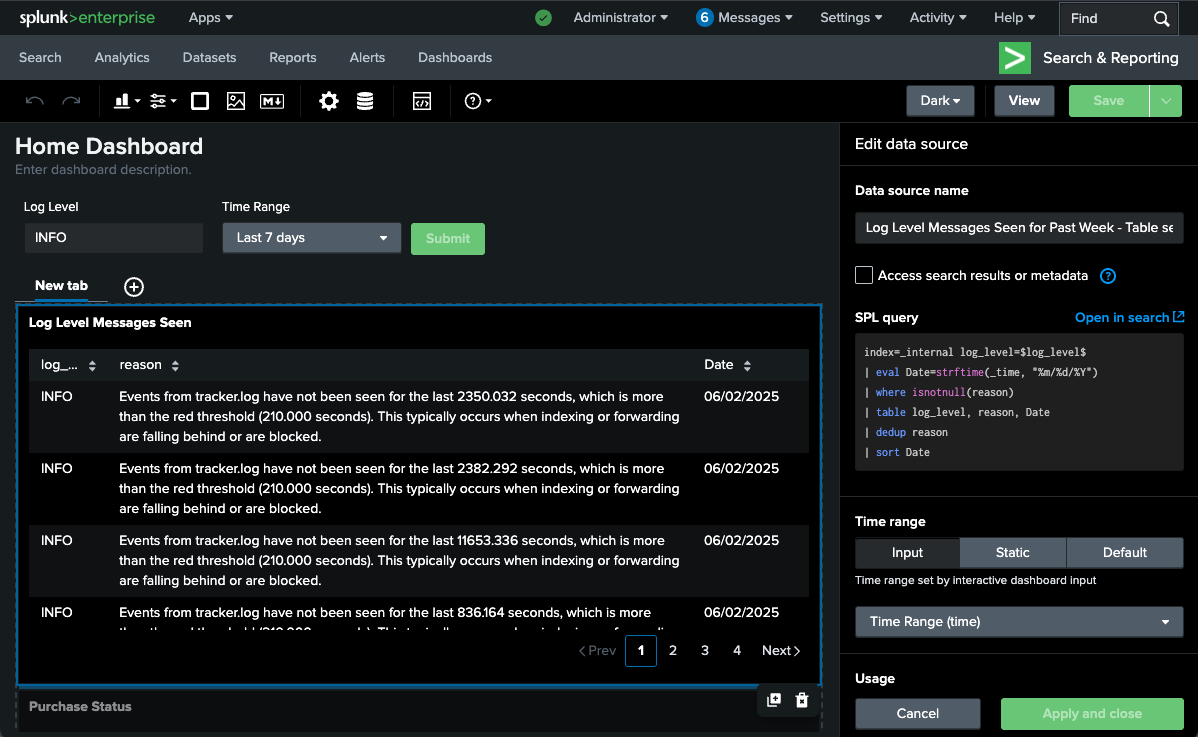
Home Dashboard
Navigate to Settings > Dashboards > Edit > Set as Home Dashboard
Demo
index=_internal log_level=*
| eval Date=strftime(_time, "%m/%d/%Y")
| where isnotnull(reason)
| table log_level, reason, Date
| dedup reason
| sort Date
Save as a dashboard panel and add input(Text) in it, then update the spl(panel data source) using token name - log_level :
index=_internal log_level=$log_level$
| eval Date=strftime(_time, "%m/%d/%Y")
| where isnotnull(reason)
| table log_level, reason, Date
| dedup reason
| sort Date
We can also add an input "Time range", then update the "Time range" of the data source as Time Range(time).
Save below search as report(schedule report) and put it into the dashboard:
index=web action=purchase categoryId=TEE
| table action, uri, status
Then we can add a interaction "Link to search" for this report. Now the field values are clickable and hyperlinked.
Or we can Add interactions "Set tokens"(Use predefined token, token name: userclick_field, token value: name, token name: userclick_value, token value: value), then add a new event(chart/panel) and set its data source index=* $userclick_field$=$userclick_value$.
Alerts
What are Alerts?
- Saved searches: run on schedule, run real-time
- Content matches: fire when a condition is matched
- Create trigger actions: log, send mail, webhook, custom action
- Create trigger conditions: per-result, # of results, # of sources, custom, throttle
Tags and events
More information about tags and events can be found here.
What's a tag?
- Quick reminder: what was I trying to see again
- Aid for reading data: create as many tags as you want
- Case sensitive: typing matters when searching
What are event types?
- Highlighter: make them colors, mark events with similar criteria
- Like a report, but not: save searches as specific event types, sort into categories, no time range. For example,
status=404can be saved as "Not Found" - More specific: set strings, field values, and tags
Demo
- Create a tag for a selected field in an event.
- Search it
index=web tag=login
Macros
Navigate to Settings -> Advanced search -> Search macros
- Shortcuts: fast, saved off searches to run by name
- Repeatable: the macro never changes, unless you edit it
- Expandable: ctrl+shift+e for windows, command+shift+e for macos
macroname: run with the use of backticks, not single quotes
Demo 1
Create a new search macro with a "Name" and "Definition", use below spl as macro definition.
index=web action=purchase
| stats count by host
| addtotals col=t row=f fieldname="Total" labelfield=host count
Then type macroexample in the search bar. This will run the macro which is equivalent to the spl above.
Demo 2
Create a new search macro loglevel(1) with below spl and a argument input.
If use arguments, you have to specify in the macro name how many arguments used.
index=_internal log_level=$input$
| table host, log_level event_message, _time
To run a macro with an argument, you need to specify what you're putting in. For example, loglevel(ERROR) or loglevel(*).
Workflows
Navigate to Settings -> Fields -> Workflow Actions
- Assess Actions: Depending on use case, there are three available workflow actions which provide different functionalities
- Create Workflow Action: Using Splunk Web, create a new Workflow Action to either push, pull or search data
- Configure Workflow Action: Within the Web GUI, configure the previously determined action type with a 3rd party source
- Validation: Check to see if data is being pushed, pulled or searched for after configuration
Workflow Actions
- GET: Create HTML links to interact with sites. Ex: Google searches, querying WHOIS databases
- POST: Generate HTTP POST request to specified URI. Ex: Create entries in management systems, forums
- Search: Launch secondary searches using field values. Ex: Occurrences of IP addresses over events
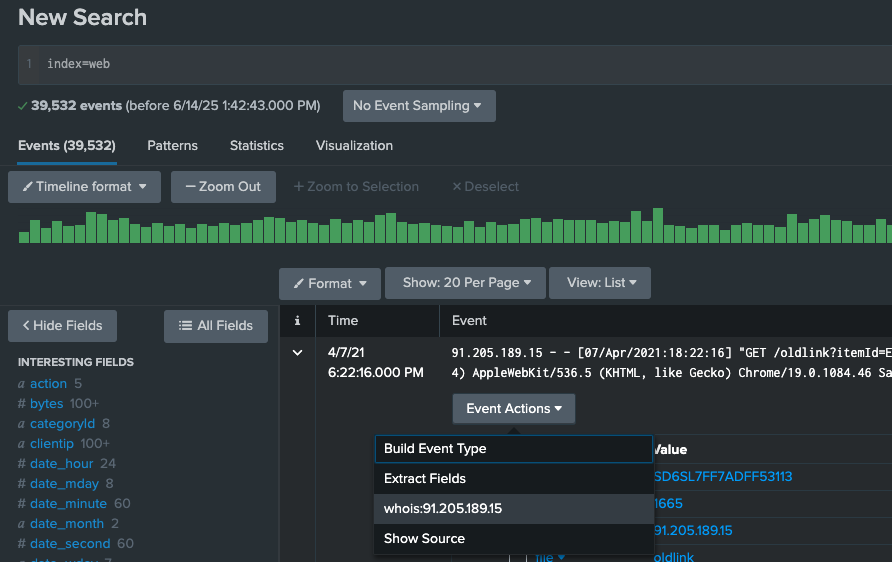
Demo
Create a new workflow actions with below configurations(default values for all other fields):
- Name: IP whois lookup
- Label: whois:$clientip$
- Apply only to the following fields: clientip
- URI: https://whois.domaintools.com/$clientip$
Change the permissions of this workflow action to "All apps(system)" with admin write and everyone read.
Now go to searching & reporting and type index=web in the search bar, expand a event and click menu "Event Actions" -> "whois:$clientip$".
Data Normalization & Troubleshooting
Navigate to Settings -> Fields -> Field Aliases / Calculated Fields
Field aliases: Normalize your data by creating a new field with a different name. Apply multiple fields to the same field alias. Make searching easier amongst users.
Calculated fields: Like a macro, but for fields. Save off quick math to output fields using the eval command, then use it in a search.
Buckets
Hot/warm/cold buckets are searchable. Warm and cold buckets cannot be written to.
- hot bucket: Data is being actively written to the bucket by an indexer. Only writable bucket.
- warm bucket: Data is getting older, rolled from hot to warm.
- cold bucket: Data is even older.
- frozen bucket: Data is going to get archived or deleted after being frozen based on the data retention policy. Data is not searchable.
- thawed bucket: Moved from frozen bucket, and the data is searchable again.
Job inspector
- tool: allows you to troubleshoot your search efficiency, or reason for failing
- informative: gives you information about how the search completed, and time it took to run
- tips: if you are using a knowledge object wrong, it will suggest how to correct your search
Demo
Field Aliases
- Figure out the source types for the indexes by using
index=web OR index=security OR index=cisco | stats values(sourcetype). - Create three field aliases with below configurations, so that all the indexes can be searched by the same field name
source_ip:- Name: source_ip
- Apply to sourcetype named {sourcetype} (sourcetype can be linux_secure, access_combined and cisco:wsa:squid)
- Field aliases: clientip=source_ip (or src=source_ip, clientip and src are the fields that have values of ip addresses)
- Then run the search
index=web OR index=security OR index=cisco source_ip=*to get all the events with ip addresses from the three indexes.
Calculated Fields
- Create a new calculated field with below configurations:
- Apply to sourcetype named access_combined
- Name: megs
- Eval expression: bytes/1024/1024
- Then run the search
index=web | stats sum(megs) as megs by file | sort - megsto get the converted bytes to megs.
Troubleshooting your SPL
- Job inspector
- Administrator -> Preferences -> SPL Editor -> Search assistant -> Full
Buckets
Returns information about the buckets in the Splunk Enterprise index.
| dbinspect index=*
| fields bucketId, state, index, modTime
Data Models
What are datamodels?
- Hierarchical: parent and child relationship. Root dataset.
- Dataset searching: select the specific datamodel and dataset you want to search.
- Normalization tool: CIM(The Common Information Model) compliance, data mapping to a model that fits that type of data.
- Large data searches: search larger amounts of data faster, with tstats and accelerated datamodels.
More information about datamodels can be found here.
Commands and use cases
Get the count of events from the Web datamodel.
| tstats count from datamodel=WebGet the count of events from the Web datamodel by sourcetype.
| datamodel Web search
| search sourcetype=*
| stats count by sourcetype
Search the root dataset Audit of the internal_audit_logs datamodel.
| datamodel internal_audit_logs Audit search
| search *
The Common Information Model
What is CIM
Common Information Model Add-on Manual
- A Model: a model to use and reference a common standard of operations for how all data is handled.
- An Application: CIM Add-On and the CIM Add-On Builder are available for free.
- Data Normalizer: in the end, all fields can have the same name. All apps can co-exist together.
How to leverage its features
- Normarlize Data: the CIM gives Splunkers a way to normalize data.
- Assistance: leverage it when creating field extractions, aliases, tags, etc.
- Datamodel command: be able to run common searches that span larger amount of data.
Why it is important
- Splunk Premium Apps: Splunk Enterprise Security relies heavily on CIM compliance data.
- Health Check Tool: Perform faster, more efficient searches that leverage searching data models instead of raw events.
- Ease of Use: Find commonality between Splunkers.
- Audit: Check to see if all of our data going into Splunk is CIM compliant.
Two CIM add-ons are available for free:
- The standard CIM Add-On
- The tool of the CIM Add-On Builder
Demo - CIM Add-On
- Navigate to Apps -> Find More Apps -> Search "CIM"
- Install add-on "Splunk Common Information Model (CIM)" and restart the Splunk server.
- Go to Settings -> Data Models, you can see there have been added some data models which come with the CIM add-on.
- Create a new event type with following configurations:
- Name: web1
- Search string:
index=web host=web1 - Tags: web (The Web data model needs the field tag to be web)
- Color: magenta
- Priority: 1 (Highest)
- Edit the permissions of the event type to "All apps(system)" with admin write and everyone read.
- Now go to the Settings -> Data models -> Web -> Pivot -> Web, there should have count of events larger than 0.
- Or run the search
| tstats count from datamodel=Webto get the count of events from the Web data model.
Demo - CIM Add-On Builder
- Navigate to Apps -> Find More Apps -> Search "Splunk Add-on Builder"
- Install add-on "Splunk Add-on Builder" and restart the Splunk server.
- Create a new add-on with a name "My Custom CIM" and leave the other fields as default.
- Go to Manage Source Types tab and click on the Add button to select Import From Splunk from the dropdown menu.
- Then Select a Source Type: access_combined* and save.
- Move to the tab Map to Data Models and click on the button New Data Model Mapping with below configurations:
- Enter a name for the event type: web2
- Select one or more source types: access_combined
- Enter a search:
(index=web sourcetype=access_combined)
- Click on the Save button to save the mapping.
- In the Data Model Mapping Details page, click on the button Select Data Model(s) on the right side of the page.
- Select the Web data model and click on the Select button.
- Click on the New Knowledge Object button and select FIELDALIAS from the dropdown menu.
- Select a field clientip on the left side to map to the field src on the right side.
- When finished mapping all fields, click on the Done button.
- Move to the tab Validate & Package, this is where you can validate and download the TA(technology add-on) package.
- Now run the search
| tstats count from datamodel=Webto get the count of events from the Web data model. The result proves that all the events are mapped to the Web data model. - Go to Settings -> All configrations, this is where you can see the TA that you just built.