Splunk Inputs
The Splunk Data Pipeline
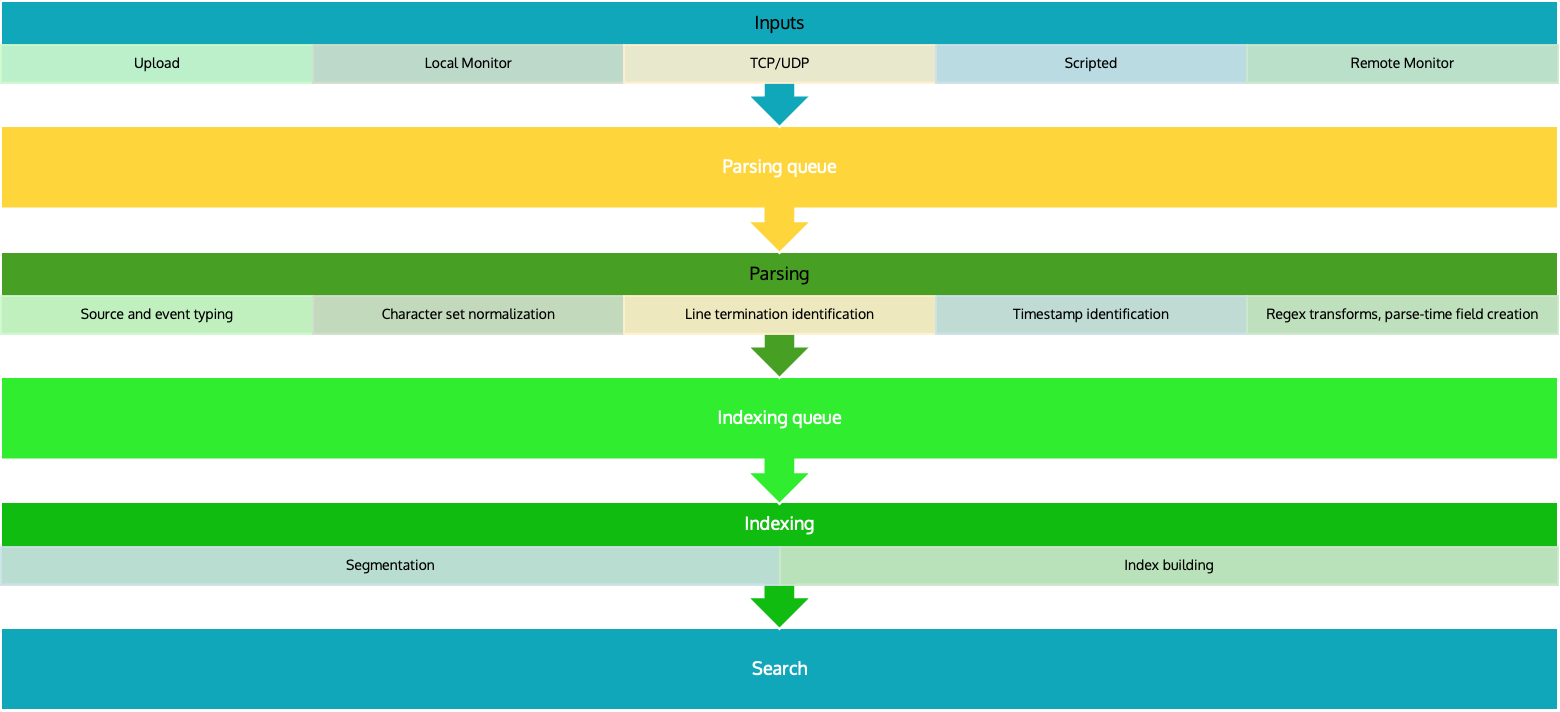
Input
In the input segment, Splunk software consumes data. It acquires the raw data stream from its source, breaks it into 64K blocks, and annotates each block with some metadata keys. The keys apply to the entire input source overall. They include the host, source, and source type of the data. The keys can also include values that are used internally, such as the character encoding of the data stream, and values that control later processing of the data, such as the index into which the events should be stored.
During this phase, Splunk software does not look at the contents of the data stream, so the keys apply to the entire source, not to individual events. In fact, at this point, Splunk software has no notion of individual events at all, only of a stream of data with certain global properties.
Parsing
During the parsing segment, Splunk software examines, analyzes, and transforms the data. This is also known as event processing. It is during this phase that Splunk software breaks the data stream into individual events.The parsing phase has many sub-phases:
- Breaking the stream of data into individual lines.
- Identifying, parsing, and setting timestamps.
- Annotating individual events with metadata copied from the source-wide keys.
- Transforming event data and metadata according to regex transform rules.
Indexing
During indexing, Splunk software takes the parsed events and writes them to the index on disk. It writes both compressed raw data and the corresponding index files into the buckets.
For brevity, parsing and indexing are often referred together as the indexing process. At a high level, that makes sense. But when you need to examine the actual processing of data more closely or decide how to allocate your components, it can be important to consider the two segments individually.
Search
The search segment manages all aspects of how the user accesses, views, and uses the indexed data. As part of the search function, Splunk software stores user-created knowledge objects, such as reports, event types, dashboards, alerts, and field extractions. The search function also manages the search process itself.
General Input Categories
- Data lakes: Unstructured or semi-structured
- Databases: Structured
- Message queues: Scripted and API inputs
- SaaS and PaaS: HubSpot, Salesforce, ServiceNow, Slack/Teams, Workday, etc.
- IaaS: AWS, GCP, Azure, OCI(Oracle Cloud Infrastructure)
- File and directory inputs
- Monitor files and directories: Locally and remotely, Monitor compressed files(Compressed files are uncompressed before they are ingested into Splunk)
- Upload: Upload files to Splunk, used for one-time analysis
- MonitorNoHandle: Available for Windows hosts only, Monitos files and directories that the system rotates automatically
- Network inputs: Data from TCP and UDP(not recommended because no guarantee it will actually get to Splunk)
- For syslog, best practice is to use Splunk Connector for Syslog. Syslog data is generally received on port 514.
- Windows inputs
- Windows event logs
- Registry
- Active Directory
- WMI(Windows Management Instrumentation provides agentless (forwarderless) access to Windows logs), Splunk recommends using forwarders instead of WMI, but WMI is still an option
- Performance monitoring(perfmon)
Other Data Sources
- FIFO queues: FIFO queues is data that you don’t intent to keep in the Splunk environment. Perhaps the data is stored elsewhere, but you still want to run it through Splunk for analysis.
- Metrics: Represent single measurement at a specific point in time, they're multi-dimensional
- Modular inputs: Modular inputs allow you to build functionality for ingesting unique data inputs like querying a database, handling sensitive or complex data
- HTTP Event Collector(HEC): lets you send data and events over HTTP. This is very useful for web-based data.
Basic Settings for an Input
Ways to Configure Inputs
- Through an app: Many apps have preconfigured inputs, for example, Splunk App for Microsoft Exchange
- Splunk web: Settings -> Data inputs or Settings > Add Data (Guided Data Onboarding - GDO)
- GDO search:
source="data.csv" host="splunksh" index="main" sourcetype="csv" | table host ip
- GDO search:
- CLI
./splunk add monitor <path>orsplunk.exe add monitor <path>- Edit config files directly: for forwarders,
inputs.confcontrols how the forwarder collects data,outputs.confcontrols how the forwarder sends data
Splunk Forwarder Types
Universal Forwarder
Collects data from a data source and forwards it to a receiver.
The source could be another forwarder in a highly distributed Splunk environment, but is most often the system whose data you want to capture. It’s like an “agent” that sits on the source system and collects and forwards data to an indexer.
An indexer could be a single indexer, an indexer cluster, or a Splunk search head/indexer combo in a small deployment.
Installed separately. The UF is the only component that is not a full Splunk enterprise instance. The UF does not search, index, or parse data
Heavy Forwarder
An advanced type of forwarder. A full installation of Splunk Enterprise, but with the Forwarder license applied.
It can parse and index data as well as forward data, can also route data based on criteria such as source.
Universal Forwarder Configuration Steps
- Configure receiving on a Splunk Enterprise instance - indexer or search head(portal)
- Download and install the UF
- Configure the least privileged user(splunkfwd)
- Configure the UF to send data
- Configure the UF to collect data from the host system
- Start the forwarder
Heavy Forwarder Configuration Steps
- Configure receiving on a Splunk Enterprise instance - indexer or search head(portal)
- Install a full Splunk Enterprise instance
- Enable forwarding on the instance: Settings -> Forwarding and Receiving -> Configure Forwarding